Data mining. Data analysis.
References
Foundations
Complement
Requisites
Introduction
What is Data mining?
Data mining is the process of finding insight patterns from data. Its goal is those patterns are information unexpected, non-trivial, useful, understandable, exact, and true.
Another point of view is in the DIKW pyramid context, where data mining converts data to information.
| What is not Data Mining? | What is Data Mining? |
| Look up how you can center a div on Stack Overflow | 60% of questions on StackOverflow is about web |
| Create a relational database in 3NF | List what is the best clients in Mexico and answer why they buy us. |
| List clients from SQL command. | What are the most related products to some user? |
Data mining tasks
The process is as follows:
Where data mining can be focused to generate descriptive or predictive information by applying algorithms, scalability concepts, computing architectures, and automation for handling large data.
Descriptive information means the process is on presenting insight into current variables from the data. Some descriptive techniques are clustering and association rules. Sometimes it’s called analytic processing.
Predictive information means the process is on presenting insight into future variables from the data. Some prediction techniques are models for the class attributes (machine learning) and anomaly detection. Sometimes it’s called inference of models.
Great opportunities but big challenges
Today, we collect, store, prepare, represent, model, reason, and visualize data to operate different data modalities such as ontologies, structured, networks, text, multimedia, and signals in order to give insights into Society’s major problems such as health care, climate change, etc. And from a market’s view, some applications are credit card fraud detection, network intrusion detection, and sales promotion.
However, some challenges are scalability, context, quality, streaming, high dimensionality, heterogeneous and complex data, data ownership and distribution, and non-traditional analysis.
Warning. Buzzwords. Marketing.
Research
Special Interest Group (SIG) on Knowledge Discovery and Data Mining (SIGKDD)
Operations Research Center
https://dl.acm.org/conference/kdd
Ecosystem
Economics Applications
Story
http://infolab.stanford.edu/~ullman/
Ethics
Concepts

Data Mining
Statistics
Probability
Machine Learning
Operations Research
IA
Data Science
Big Data
Data Analytics
Business Analysts
Domain Experts (Subject matter experts)
Domain Mining expert.
FAQ
Notes and references
Data mining project management
What is the scope of the project? Which questions have to answer?
Workers:
- Project leader.
- Specialist in data analysis/data mining.
- Expert with knowledge of the domain.
- Information technology (IT) support.
- Consumer.
Objectives
Deliverables
Roles and responsibilities
Current situation
Timeline
Costs and benefits
Input: Concepts, Instances, and Attributes. Data preparation. Data preprocessing.
graph TD
  DataPreparation[Data preparation] --> DataCleaning["Data Cleaning"]
  DataPreparation[Data preparation] --> FeatureExtraction["Feature extraction"]
  DataPreparation[Data preparation] --> DataTrasnformation["Data transformation"]
  DataPreparation[Data preparation] --> DataNormalization["Data normalization"]
  DataPreparation[Data preparation] --> MissingDataImputation["Missing Data imputation"]
  DataPreparation[Data preparation] --> NoiseIdentification["Noise identification"]
This is the most time-consuming step.
We suppose data exists, but sometimes is harder to use. So, Data mining doesn’t concern data collection or generation. But, quality data is necessary in order to make a good analysis. What is quality data? It’s a statistics question.
DataWarehouse and OLAP technology.
Data sources
The most important factor to analyze data is the quality of the data, which means data is reliable and represents the defined target population.
You must get data from studies such as
- Surveys or polls.
- Experiments.
- Observational and other studies.
You must get data from the daily operations of an organization such as
- Operational Databases.
- Data warehouses.
- Historical databases.
- Purchased data.
Telemetry
Data preparation steps
The following are steps to prepare data:
1. Create a data table from different sources.
You must query data sources such as operational databases, surveys, experiments, data warehouses, and historical databases, and integrate them as a data table.
We suppose a table but for other purposes XML or JSON.
Data Wrangling
https://missing.csail.mit.edu/2020/data-wrangling/
2. Characterize variables. Data understanding.
You must characterize your data table in standard ways.
Observations, Variables, data value.
graph TD
Object --> Observations| Variable X_1 | Variable X_2 | Variable X_3 | Variable X_4 | |
| O1 | ||||
| O2 | ||||
| O3 | ||||
Observations are entity registers where variables describe them. A class instance.
Independent variables are sometimes called features.
Dependent variables are what you look up for. They are sometimes called targets.
Variables are observation attributes, so variables are sometimes called attributes.
Class attributes???
attributes?
Variable roles can be target or feature.
Your measurement has got to have units. Please, use International standards.
Random variables?
https://www.statisticshowto.com/attribute-variable/
Continuous and Discrete variables and their data type.
If variable X is 1 value where , then it is constant.
If variable X is 2 values, then it is dichotomous.
If variable values are , then it is discrete.
If variable values are , then it is continuous.
Identify data type by Variable.
Scales of Measurement
Scales of measurement are the relationship restriction between variable values and sensitivity. In general, it is a better high than low, where the highest is the Ratio.
| Is it a partially ordered set? Is it a meaningful order? | Is it a meaningful distance? | Does it have absolute zero? It means that the lowest element in the set has got to be 0. It is a linear unit? It is proportional? | Example | |
| Nominal. It names things. | No. | No. | No. | Eye colors whose values are “blue” and “brown”. |
| Ordinal. It shows the position of something in a list, and nothing else. So, it is about order rather than amount. | Yes. | No. | No. | Level of satisfaction whose values are “low”, “medium”, and “high”. |
| Interval. It represents amounts rather than orders. | Yes. | Yes. | No. | Celsius and Fahrenheit. |
| Ratio. It represents proportions. | Yes. | Yes. | Yes. | Kelvin and Rankine. |
Cardinal vs Ordinal??
Roles in analysis
ID. These variables identify observations. For example, name.
Descriptors. These variables whose only purpose is describing data.
Response (classes or labels). These variables are predictive model outputs.
Frequency distribution
Variables.
Case study
Check out how the Iris flower data set or Fisher's Iris data set is understood.
References
Guyon & Elisseeff - An Introduction to Variable and Feature Selection - Journal of Machine Learning Research 3 (2003) 1157-1182
3. Clean data and deal with missing values
Consolidate observations
References
Computerphile. (2015, October 09). The Trouble with Missing Data - Computerphile. Youtube. Retrieved from https://www.youtube.com/watch?v=oCQbC818KKU&ab_channel=Computerphile
High-Dimensional Data Analysis with Low-Dimensional Models: Principles, Computation, and Applications John Wright and Yi Ma
4. Data reduction.
Data reductions ways
We can manually remove variables that will not contribute to any analysis in obvious variables and small datasets.
graph TD
  Reduction["Reduction techniques"] --> DR["Data reduction"]
  Reduction["Reduction techniques"] --> SR["Sample numerosity reduction"]
  Reduction["Reduction techniques"] --> CR["Cardinality reduction"]
  DR --> FeatureExtraction["Feature extraction/construction"]
  DR --> PCA["Principal component analysis"]
  DR --> FactorAnalysis["Factor analysis"]
  DR --> MDS["Multidimensional Scaling"]
  DR --> LLE["Locally linear embedding"]
Other positive effects on the data reduction are:
- Speed up the processing of the DM algorithm.
- Improve data quality.
- Make the results easier to understand.
But how do you search for the correct data? A brute force search has an average performance of where is the feature cardinality and is the desired number of features in the subset. So, it’s not a good idea.
The following are the most relevant techniques that solve it.
Instance selection or generation
NEAREST NEIGHBOR RULE
https://www.cs.rit.edu/~rlaz/PatternRecognition/slides/kNearestNeighbor.pdf
Dimension reducer. Features selection. The curse of dimensional
Principal Component Analysis (PCA)
Factor analysis
Similarity search
K-Nearest Neighbors (KNN) and Approximate Nearest Neighbors (ANN) are different approaches to finding nearest neighbors in a dataset.
Similarity.
Distance measures. Metric spaces.
Jaccard distance.
Cosine distance.
Edit distance.
Hamming Distance.
LS Families of Hash Functions
S-Curves
How can I solve problems with no training set is available?
Design a measure (”score”) of how similar records
K-Nearest Neighbors (KNN)
- Exact Search:
- KNN is an exact algorithm that searches for the k closest points in the dataset to a given query point based on a specific distance metric (e.g., Euclidean distance, Manhattan distance).
- Algorithm:
- The basic KNN algorithm involves computing the distance from the query point to every other point in the dataset, sorting these distances, and selecting the top k closest points.
- This can be computationally expensive for large datasets, with a time complexity of O(n⋅d), where n is the number of points in the dataset and d is the dimensionality of the data.
O(n⋅d)
- Data Structures:
- Optimizations for KNN searches include data structures like KD-Trees or Ball Trees, which can speed up the search process for lower-dimensional data but may still struggle with high-dimensional data.
- Accuracy:
- KNN guarantees finding the exact nearest neighbors.
Approximate Nearest Neighbors (ANN)
- Approximate Search:
- ANN algorithms aim to find neighbors that are close to the true nearest neighbors but may not be the exact nearest. The goal is to significantly reduce computation time and memory usage while maintaining high accuracy.
- Algorithm:
- ANN algorithms use various techniques to approximate the search, including:
- Locality-Sensitive Hashing (LSH): Hashes points into buckets such that similar points fall into the same bucket with high probability.
- Random Projection Trees: Uses random projections to partition the space and quickly narrow down the search area.
- Vector Quantization: Compresses the dataset into representative points and searches within these compressed representations.
- Graph-based Methods: Constructs a graph where edges represent proximity, allowing for efficient traversal to find nearest neighbors.
- ANN algorithms use various techniques to approximate the search, including:
- Efficiency:
- ANN algorithms are designed to handle large-scale and high-dimensional datasets efficiently. They often have a sub-linear time complexity with respect to the number of points in the dataset.
- Trade-offs between speed and accuracy can be adjusted by tuning algorithm-specific parameters.
- Accuracy:
- ANN does not guarantee finding the exact nearest neighbors but aims to find neighbors that are sufficiently close with high probability.
- The trade-off between accuracy and efficiency is a key characteristic of ANN methods.
Instead of searching exhaustively, we make use of Approximate Neighbor Search Algorithms, which can be split into three categories: trees, hashes, and graphs. Similarly, we need
Many data-mining problems can be expressed as finding “similar” sets:
- Pages with similar words. Web farming. Plagiarism. Similar new articles at many new sites.
- Recommendation systems.
- Entity resolution.
Three essential techniques for similar documents:
Shingling: convert documents, emails, etc., to sets.
Minhashing: convert large sets to short signatures, while preserving similarity.
Locality-sensity hashing
False-negatives
False-positives
Entity-resolution
https://github.com/moj-analytical-services/splink
https://github.com/dedupeio/dedupe
Fingerprint matching
Feature extraction
Textual
Latent Semantic Analysis (LSA)
Probabilistic Latent Semantic Analysis (pLSA)
LDA
A Bayesian version of pLSA
LSI
lda
5. Transform variables. Simplification.
Normalization or Regularization
L1, L2, L
Min-Max
Z-score
Decimal Scaling Normalization
Encoders
HotEncoder
LabelEncoders
Value mapping.
Distributed file system and MapReduce
Discretization.
Formally, it means giving examples and a target classes.
Some algorithms are ChiMerge, CAIM,
Output: Decision tree (C4.5 algorithm), Aprori, KNN, and Naive Bayes.
Tools. A
Meta-learning.
Some properties are static (versus dynamic), univariate (versus multivariate), supervised (versus unsupervised), splitting (versus merging), global (versus local), direct (versus incremental), evaluation measures (they are provided by domain or algorithm), parametric (versus nonparametric), disjoint (versus nondisjoint) —fuzzy logic, ordinal (versus nominal).
We compare methods using a number of intervals, inconsistent, predictive, …
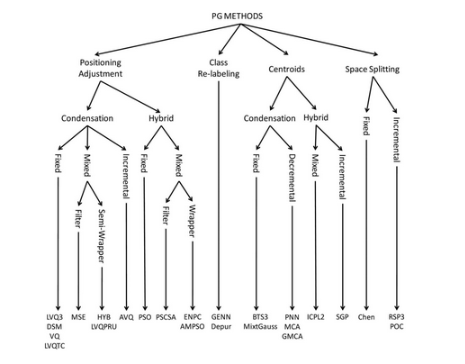
Taxonomy.
Wu, X., Kumar, V., Ross Quinlan, J.,
Ghosh, J., Yang, Q., Motoda, H., ... & Steinberg, D. (2008). Top 10
algorithms in data mining.
Knowledge and information systems, 14(1), 1-37.
Data discretization: taxonomy and big data challenge (2015). Sergio
Ram ́ırez-Gallego, Salvador Garc ́ıa, H ́ector Mouri ̃no-Tal ́ın, David
Mart ́ınez-Rego, Ver ́onica Bol ́on-Canedo, Amparo Alonso-Betanzos,
Manuel Ben ́ıtez, and Francisco Herrera. Wiley Interdisciplinary Reviews:
Data Mining and Knowledge Discovery 6(1):5-21. DOI:
10.1002/widm.1173
Linear Transformations
Quadratic transformations
Non-polynomial Approximations of Transformations
Polynomial Approximations of Transformations
Rank Transformations
Box-Cox transformations
Dimension reduction methods
Transformations via Data Reduction
Algorithms
Aggregation.
6. Segment table
Create subsets of data to facilitate analysis and answer specific questions.
Random Samples.
Concept description: Characterization and comparison
References
García Salvador Luengo Julián & Herrera F. (2015). Data preprocessing in data mining. Springer International Publishing : Imprint : Springer. https://doi.org/10.1007/978-3-319-10247-4
FAQ
How do I prepare images?
Output: Knowledge Representation. Implementation of the analysis.
Descriptive modeling and predictive modeling.
Data Analytics
The category outputs that are determined by are
- Summarizing the data. .
- Finding hidden relationships.
- Making predictions.
They interact among themselves.
The methods are
- Summary tables
- Graphs
- Descriptive statistics
- Inferential statistics
- Correlation statistics
- Searching
- Grouping
- Mathematical models
Implementation
Worked example
The next table shows a series of retail transactions monitored by the main office of a computer game store.
Generate a contingency table summarizing the variables Store and Product category.
Generate the following summary tables:
- Grouping by Customer and the showing a count of the number of observations and the sum of Sale price ($) for each row.
- Grouping by Store and showing a count of the number of observations and the mean Sale price ($) for each row.
- Grouping by Product category and showing a count of the number of observations and the sum of the Profit ($) for each row.
Create a histogram of Sales price ($) using the following intervals 0 to less than 20, 20 to less than 30, 30 to less than 40, 40 to less than 50.
Create a scatterplot showing Sales price ($) against Profit ($)
Solution.
https://gist.github.com/sanchezcarlosjr/10fbc3d4ec8e5118d4a2960c0e67f0e7
Measurement and Data
Data Mining Primitives, Languages, and System Architectures
Visualizing and Exploring data. Exploratory Data Analysis (EDA).
Data visualization
https://github.com/Kanaries/Rath?tab=readme-ov-file
https://data-explorer.nteract.io/#/Documentation
DataPrep, Pandas-profiling, SweetViz, Lux, and D-Tale
Descriptive modeling
Finding patterns and rules
Data Analysis and Uncertainty
Mining Association rules in large databases
Cluster Analysis
Mining Complex Types of Data
Dashboard
https://developer.mescius.com/activereportsjs
https://developer.mescius.com/activereportsjs/docs/v2.0/GettingStarted/QuickStart/QuickStart-Vue
https://www.fast-report.com/en/fast-reports-partner-program/
Box plots
https://psychologicabelgica.com/articles/10.5334/pb.az
https://nightingaledvs.com/ive-stopped-using-box-plots-should-you/
Tables and Graphs
https://www.grapecity.com/activereportsjs/vue-reporting-tool
Diagrams from a Domain-specific language (DSL)
https://mermaid-js.github.io/mermaid/#/
Graphviz
https://avdi.codes/tools-for-turning-descriptions-into-diagrams/
https://www.augmentedmind.de/2020/12/20/plain-text-diagrams-as-code/
https://modeling-languages.com/text-uml-tools-complete-list/
What's the difference between a graph, a chart, and a plot?
Images
Statistics
Grouping
Supervised vs unsupervised
Grouping methods are methods whose goal is segmenting, finding hidden relationships, and understanding data.
Cluster
Types of variables
Data set limit
Interpretable and actionable
Overlapping groups
Identify outliers
endograma
Hierarchical Agglomerative Clustering
K-Means
Preconditions.
- Data measurement should be Interval.
- Don’t mix units.
- Data should be normalized.
k_means(data, k groups)
   allocate an observation randomly
Association rules
The Association rules method is an unsupervised groping method.
Preconditions.
- Data measurement should be Categorial (Nominal or Ordinal).
- Instances have to be 0 or 1.
Apriori algorithm
Decision trees
Preconditions.
- Categorical and continuous variables.
FAQ
Prediction
Predictive
Predictive Modeling for Classification
Predictive Modeling for Regression
Models and Patterns. Classification and Prediction
Real Machine Learning
- Unsupervised learning. No classes or Labels.
- Clustering.
- Dimensionality.
- Supervised learning. Classes or Label.
- Classification.
- Regression.
- Deep learning.
- Reinforcement learning.
Paradigms of Machine Learning.
Symbolysts.
Connectionists
Bayesians.
Analogizers.
Evolutionaries.
The task of Machine Learning.
Classification. If you have discrete labels, then you need classification algorithms.
Regression. If you have continuous labels, then you need regression algorithms.
Contingency table and confusion matrix.
Holdout (1/3 testing, 2/3 training).
K-fold cross-validation K=10.
Linear Regression.
Nonlinear regression. If you can, transform nonlinear regression to a linear relationship using a mathematical transformation.
Data transformations
Ensemble Learning
Moving on
Classification
Classification trees
k-Nearest Neighbors
Logistic regression
Naive Bayes classifiers
Neural networks
Rule-based classifiers
Support vector machines
Regression
Regression trees
k-Nearest Neighbors
Linear regression
Neural networks
Nonlinear regression
Partial least squares
Support vector machines
Associate rules
Regression modeling
Multiple regression and model building
Logistic regression
Naive Bayes estimation and Bayesian networks
Topological Data Analysis
https://www.youtube.com/watch?v=VkVhFOYSgWk
https://www.youtube.com/watch?v=_j85xMTZIWQ&list=PL8erL0pXF3JaR4no7ivppQ5zwhq2QnzzQ
Topological Data Analysis with Applications by Carlsson & Vejdemo-Johansson
Tools
Weka
Data Mining: Practical Machine Learning Tools and Techniques
https://www.cs.waikato.ac.nz/ml/weka/
Search and Optimization Methods
Locality-Sensitive Hashing
Score Functions for Data Mining Algorithms. Credibility: Evaluating What’s been learned
Anomaly detection
Novelty detection with Local Outlier Factor (LOF)
Outlier detection with Local Outlier Factor (LOF)
Isolation Forest (IF)
Supervised vs Unsupervised Methods
Tree
KDDCUP99
Synthetic Dataset
Subspace outlier detection
Density-based (DBSCAN)
Distance-based (LOF)
Distance-based KNN KMEANS Regiression Hyperplane distance
Parametric GMM Single Class SVM Extreme value theory
Statistical tests (Z-score), variations on the above
Synthetic data set contains made-up transactions with some exhibiting known red flags.
For more red flags see:
The core idea is to use red flags as data models to transform trades/transactions data into lower dimensional sub-space. No need for many factors, as simple two-dimensional summaries by red flag/model can work well.
Jupyter notebook can be shared on request. Contact me: www.codefying.com
Retail Bank
- Credit card fraud
- ML through Retail Bank
Private Bank
- Market abuse
- ML through Private Bank
- Other fraud
Investment Bank
- Market abuse
- ML through Investment Bank
- Other fraud
Done in Different Ways, Requires Different Approaches Because RED FLAGS are banking-type specific (especially the layering/structuring stage).
https://www.youtube.com/watch?v=5p8B2Ikcw-k
Red flags are indicators or warning signs that suggest the possibility of fraudulent or suspicious activities within financial transactions. These indicators are used by financial institutions to detect potential money laundering, fraud, or other illicit activities. Red flags vary depending on the type of banking institution and the specific transactions involved. Some common examples of red flags include:
- Unusual transaction patterns or volumes that do not fit the customer's profile.
- Transactions that are inconsistent with the customer's business or income.
- Multiple accounts used to transfer large sums of money with no apparent business or legal purpose.
- Rapid movement of funds between various accounts, especially across different countries.
- Transactions involving countries known for high levels of corruption or money laundering activities.
- Attempts to evade reporting requirements by structuring transactions just below reporting thresholds.
Each type of banking institution (retail, private, investment) may have its own specific set of red flags based on the typical activities and risks associated with that type of bank.
References.
- C.C. Aggarwal, Outlier Analysis, 2nd edition, Springer, 2017.
- A. Sudjianto et al., "Statistical Methods for Fighting Financial Crimes," Technometrics, vol. 52, 2010.
- F.T. Liu et al., "Isolation Forest," Data Mining, 2008. ICDM'08, Eighth IEEE International Conference.
- U.S. Congress, Office of Technology Assessment, Information Technologies for the Control of Money Laundering, Sep. 1995, OTA-ITC-630.
- R.J. Bolton and J.D. Hand, "Statistical Fraud Detection: A Review," Statistical Science, 17, 2002.
Data Organization and Databases
Evaluation & Deployment
Some kinds of deliverables are
- Static report to management.
- Software integration.
Then, measure and monitor performance and review the project.
Report examples
https://raw.githubusercontent.com/mrsac7/Data-Mining-Project/master/Report.pdf
Storytelling
Summary
Data mining process

• Kurgan L. A. and Musilek P. (2006). A survey of Knowledge discovery and Data Mining process models. The Knowledge Engineering Review, Vol. 21:1, 1-24. doi:10.1017/S0269888906000737. Recuperado de: http://biomine.cs.vcu.edu/papers/KER-KDDM2006.pdf
Software Ecosystem
Hex - Do more with data, together. (2022, December 12). Retrieved from https://hex.tech
SAS SEMMA???
- The WEKA data mining workbench
- Microsoft’s OLE DB for Data Mining
- DBMiner
- Clementine data mining suite
- SPSS statistical software
- SAS Enterprise Miner
Applications and Trends in Data Mining
Information filtering and information retrieval
Recommendation systems
https://dl.acm.org/doi/pdf/10.1145/138859.138861
Full-Text Search, Information Retrieval and Information Filtering
Knowledge graphs
OpenCypher
Natural Language Processing
Project ideas to learn data mining
Email spam detector
Modeling response to direct mail marketing
Wordnet
https://archive-beta.ics.uci.edu/
Intelligence
https://www.fbiic.gov/public/2008/feb/ODNI_Data_Mining_Report.pdf
References
Case of study
https://arxiv.org/pdf/0803.2969.pdf
TODO
Map-reduce and the new software stack
Mining data streams
Link analysis
Frequent itemsets
Clustering
Advertising on the Web
MIning Social-Network graphs
Dimensional reduction
Large-scale Machine Learning
Neural Nets and Deep Learning