Review on Visualizing Data using t-SNE
t-SNE is based on Sam Roweis and Geoffrey Hinton’s Stochastic Neighbor Embedding method [1], a t-distributed variant.
t-SNE is a statistical nonlinear method that reduces high-dimensional data optimizing
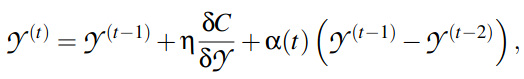
where
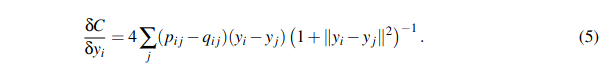
n, are parameters, the first one indicates learning rate, and the second one indicates momentum, the rest of values are calculated in the algorithm, they are conditional probabilities called pairwise affinities with perplexity.
The t-SNE chief goal is visualizing large data sets in a two or three-dimensional map, it performs better than related algorithms such as SNE, PCA, … It works on time .
But, its drawbacks is that is no clear how to perform on general dimensional reduction task and it is not guaranteed to converge to a global optimum.
Since presented results [2], t-SNE has been a useful contribution in wide range of applications.
[1] Roweis, Sam; Hinton, Geoffrey (January 2002). Stochastic neighbor embedding (PDF). Neural Information Processing Systems.
[2] Laurens van der Maaten and Geoffrey Hinton (200). Visualizing data using t-SNE. Journal of Machine Learning Research, 9(2605), pp. 2579-2605. Recuperado de: https://www.jmlr.org/papers/volume9/vandermaaten08a/vandermaaten08a.pdf