Probability
Requisites
- Set theory
Story
Characters
Andrey Kolmogorov
Key questions
Why use probability and no other mechanism?
Statistics or probability
Why study probability?
Love of wisdom.
But if you want to win someone.
I am not much given to regret, so I puzzled over this one a while. Should have taken much more statistics in college, I think.”—Max Levchin?, Paypal Co-founder, Slide FounderQuote of the week from the Web site of the American Statistical Association on November 23, 2010
Luck. Coincidence. Risk. Doubt. Fortune. Chance. Uncertainty. What is that called Randomness?
R vs Python vs MATLAB vs Octave vs Julia
https://www.linkedin.com/pulse/r-vs-python-matlab-octave-julia-who-winner-siva-prasad-katru/
Is a story proof fully valid mathematical proof?
[2] book.
If they are dependent events, then an event causes the other one — and vice versa.
Probability
Outcome. A possible result of an experiment.
Sample space. A set of all outcomes of an experiment.
Probability function. One that assigns probabilities to the outcomes. , such that
.
Event. A subset of the sample space, .
Population. Not yet.
Experiment. Activity.
What is the probability goal? Probability measures the chance that event A will occur, it detonates as . Probability doesn't say what are good decisions and does not predict the future!
How to think about the elements of a sample? Remember each element of a sample ontologically are different, A is A -Law of identity-. For example, If have a set of books, each book has a characteristic of being different.
Probability modeling
Tree Model
Conditional probability.
P[Postpostriority|Apostriori]
A Set Theory Dictionary for probability problems [2]
no element of , implies at least a element of 
https://en.m.wikipedia.org/wiki/Base_rate_fallacy
Probability approaches
Classical Approach or Naive Probability
Where S is a finite sample space and an event and with outcomes equally likely.
Example. Birthday problem. There are people in a room. Assume each person's birthday is equally likely to be any of the 365 days of the year (we exclude February 29), and that people's birthdays are independent (we assume there are no twins in the room). What is the probability that two or more people in the group have the same birthday?
- Frank, P.; Goldstein, S.; Kac, M.; Prager, W.; Szegö, G.; Birkhoff, G., eds. (1964). Selected Papers of Richard von Mises. 2. Providence, Rhode Island: Amer. Math. Soc. pp. 313–334.
Assume outcomes equally likely, then naive probability apply.
But to calculate is hard, thus we calculate his complement.
❓Is Yes, It is. Then complement too, i.e. .We know that ,his cardinality also called permutation is equal to .
Therefore,
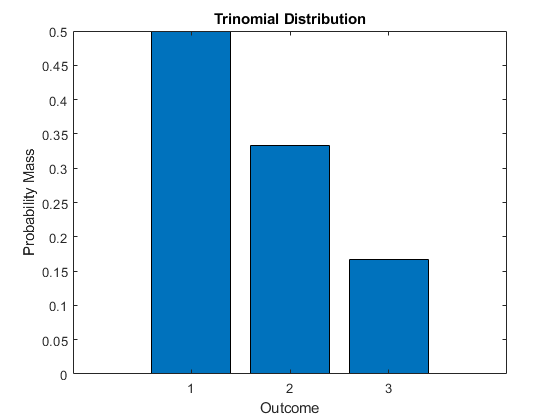
Figure: Probability that in a room of k people, at least two were born on the same day. This probability first exceeds 0.5 when k=23. For k≥366 we are guaranteed to have a match [2].
The Personal Opinion Approach
The worst knowledge.
Relative Frequency Theory
Probability interpretation?
Statistics? Repeat experiment n times, that is S.
Modern Approach or Axiomatic Probability
The general definition of probability. A probability space consists of a sample space ; an event space, or a set of events such that ; and a probability function, which takes an event and returns , satisfying the following axioms:
We can see that assigns each event, a real number between 0 and 1, as output, i.e. .
Theorem 1.1 Let be mutually exclusive events, then
Theorem 1.2
Proof.
Assume that and are disjoint events and their union is .
By second axiom and first theorem
Theorem 1.3
Proof.
Theorem 1.4 (Inclusion-exclusion). For any events
Proof.
Worked examples.
A die is a cube whose 6 sides are labeled with the integers from 1 to 6. The die is fair if all 6 sides are equally likely to come up on top when the die is rolled. The plural form of "die" is "dice". Why
A palindrome is an expression such as "A man, a plan, a canal: Panama" that reads the same backwards as forwards, ignoring spaces, capitalization, and punctuation. Assume for this problem that all words of the specified length are equally likely, that there are no spaces or punctuation, and that the alphabet consists of the lowercase letters a,b,…,z. Why
Three people get into an empty elevator at the first floor of a building that has floors. Each presses the button for their desired floor (unless one of the others has already pressed that button). Assume that they are equally likely to want to go to floors through (independently of each other). What is the probability that the buttons for consecutive floors are pressed?
Why the probability that all 3 people in a group of 3 were born on January 1 is less than the probability that in a group of 3 people, one was born on January 1, another one was born on January 2, and the remaining one was born on January 3?
Martin and Gale play an exciting game of "toss the coin," where they toss a fair coin until the pattern HH occurs (two consecutive Heads) or the pattern TH occurs (Tails followed immediately by Heads). Martin wins the game if and only if the first appearance of the pattern HH occurs before the first appearance of the pattern TH. Note that this game is scored with a 'moving window'; that is, in the event of TTHH on the first four flips, Gale wins, since TH appeared on flips two and three before HH appeared on flips three and four. Why is true that Martin is less likely to win because as soon as Tails is tossed, TH will definitely occur before HH?
Elk dwell in a certain forest. There are Nelk, of which a simple random sample of size n are captured and tagged (“simple random sample" means that all sets of n elk are equally likely). The captured elk are returned to the population, and then a new sample is drawn, this time with size . This is an important method that is widely used in ecology, known as capture-recapture. What is the probability that exactly of the elk in the new sample were previously tagged? (Assume that an elk that was captured before doesn’t become more or less likely to be captured again.)
Dos cantidatos A y B presentaran un Test. La probabilidad de que A aprueba es 1/7, de B 2/9. ¿Cual es la probabilidad de que al menos uno de los cantidatos aprueba?
Montmort's matching problem.
R, "Vector thinking".
If you want to create a vector.
# name <- c(values)
vector <- c(3,1,4,1,5,9)
It is a structured language.
fn(parameters)If you want a get the largest value.
max(vector)When you want to create simulation.
sampleMontmort's matching problem.
Birthday problem.
Python
Julia
Conditional probability
Definition.
Let A and B events with , the conditional probability of A given that the event B has occurred or A given B is denoted by , is defined as
The conditional probability is a learning process, where shows our knowledge of event A before the experiment takes place, that is a priori probability of A and B is the evidence we observe.
means A and B happen simultaneously. But, A happen by B.
Prosecutor's fallacy
Monty Hall
Bayes
Informally, you might think Bayes
Worked examples
Mr. Jones has two children. The older is a girl. What is the probability that both children are girls? Mr. Smith has two children. At least one of them is a boy. What is the probability that both children are boys? This was posed by Martin Gardner in Scientific American.
Assume that gender is binary, , and that the genders of two children are independent.
, where position indicate what child is older.
A spam filter is designed by looking at commonly occurring phrases in spam. Suppose that 80% of email is spam. In 10% of the spam emails, the phrase "free money" is used, whereas this phrase is only used in 1% of non-spam emails. A new email has just arrived, which does mention "free money". What is the probability that it is spam?
The screens used for a certain type of cell phone are manufactured by 3 companies, A, B, and C. The proportions of screens supplied by A, B, and C are 0.5, 0.3, and 0.2, respectively, and their screens are defective with probabilities 0.01, 0.02, and 0.03, respectively. Given that the screen on such a phone is defective, what is the probability that Company A manufactured it?
A family has 3 children, creatively named , , and .
Discuss intuitively whether the event " is older than " is independent of the event " is older than ".
Maybe You think something as "They are independent events since their causality a priori is contingent, no necessary". But It is not true, They are dependent events. Empirically or a posterior relation We can see that if there are n children, call them , then writing to mean that is older than and writing to mean that is the oldest than them.
- Exists evidence about fits into birth order first place, but no .
- is very old. It's hard than is older.
Therefore, They are dependent events since decreases the probability for being the highest age when happens, that is exists a causality.
Find the probability that is older than , given that is older than .
, where each element is a birth order.
Random variables and their distributions
Expectation
Continous random variables
Momements
Joint distributions
Transformations
Overview and descriptive statistics
Data.
Statistician collects data.
Population. Set of measurements of interest to the experimenter.
What? Sample. Subset of population.
Variable. Characteristic that changes about experimental unit under experiment. Examples. Hair color.
Who? Experimental units. Objects on which a variable is measured. Blackbox is an active subject.
A measurement or datum results when a variable is actually observed on an experimental unit.
A set of measurements, called data, can be either a sample or a population. I.e. or .
Variables types. Qualitative measure a characteristic, Quantitative measure a numerical quantity: discrete or numerable and continuous or not numerable.
How many variables have you measured?
- Univariate data.
- Bivariate data.
- Multivariate data.
.png)
.png)
Statistics
| Descriptive Statistics | Inferential Statistics |
|---|---|
| We can enumerate the population easily. | We cannot enumerate the population easily. So We choose a sample. |
| Describe population. No need for inference. You can get the conclusions. | Inference (i.e. supposed conclusions) about the population from samples. |
Get samples to inference population, then predict future about a black-box, guarantee a stable knowledge and make decisions. Remember past results are no guarantee of future performance. There are three kinds of lies….. Lies Damn Lies Statistics You need to make statistics work for you, not lie for you!
Inferential statistics
- Define the objective.
- Design of the experiment.
- Collect data with math standard.
- Make inferences.
- Determine reliability of the inference.
Graphing Variables
Use a data distribution to describe:
- What values of the variables have been measured?
- How often each value has occurred?
Graphing Qualitative Variables
Graphing Quantitative Variables
Descriptive Statistics
Measures of Location
Measures of Variability
Chebyshev theorem
Z-score
z-score (also called a standard score) gives you how far from the mean a data point by standard deviation.
Standard deviation.
Probability
Definition. Probability is the logic of uncertainty.
Set dictionary
Vandermonde's identity
Naive probability
How to count?
If you want to count outcomes, how to count them?
Experiment.
Experiment random.
Sample spaces. All possible outcomes.
Event. Set of possible outcomes.
Elementary event. Events containing only one outcome are called elementary events and they are written interchangeably for simplicity.
Experimental probability is probability that is determined on the basis of the results of an experiment repeated many times. When we compute the probability of a future event based on our observations of past events.
Theoretical probability is probability that is determined on the basis of reasoning. Axiomatic.
Combination
Bayes
Condictional
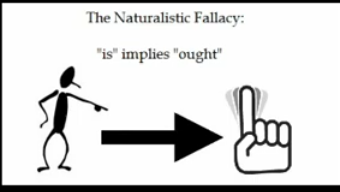
Philosophical questions
Worked examples
Random Variables
Def.
Probability Distributions for Discrete Random Variables.
If X is a discrete random variable, the function given by f(x)=P(X=x) for each x within the range of X is called the probability distribution of X.
Probability Distributions for Continuous Random Variables. Probability density function.
F(x) probability distribution function. f(x) density function
sigma = (table,mu) => Math.sqrt(
							table.reduce((acc, currentValue) =>
									acc+=Math.pow(currentValue[0]-mu, 2)*currentValue[1], 0)
						 )
Funciones
| Name | Tags | Concepto |
|---|---|---|
| función de probabilidad o función de masa de probabilidad | Discretas | |
| función de densidad | Continuas | |
| Función de distribución o función de distribución acumulada | ContinuasDiscretasF | Suma de las funciones de probabilidades o de densidad. |
| Untitled |
Distributions
// Por traducir al ingles. Ejemplos trabajados.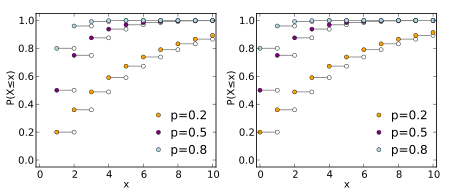
Distribución Discreta Uniforme
¿Qué caracteriza o mide la variable aleatoria?
La distribución discreta uniforme se caracteriza por su constante probabilidad con respecto a los valores del dominio de una variable aleatoria discreta. A saber, sus parámetros son a y b.
Fórmula y gráfica de la distribución.
Asi la función de masa de probabilidad o función de probabilidad de una variable aleatoria que es uniforme es: , para donde cuando . Su gráfica: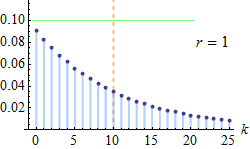
Su función acumulada: . Donde esl argumento de la función, es el ínfimo del dominio y el supremo del mismo. Gráfica: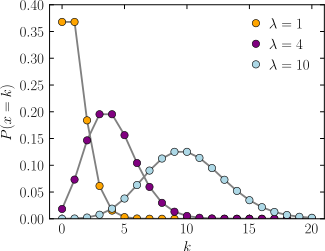
https://dk81.github.io/dkmathstats_site/rmath-uniform-plots.html
Función generadora de momentos.
Media.
Varianza.
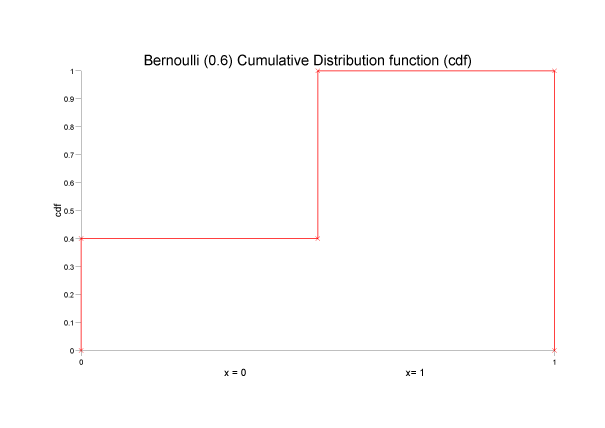
Distribución Bernoulli
¿Qué caracteriza o mide la variable aleatoria?
Mide la probabilidad de exito de un experimento con dos resultados posibles: "exito" y fracaso, sus probabilidades son y respectivamente. Tal que, el numero de exitos tiene un distribucion de Bernoulli. A saber, su parametro es
Fórmula y gráfica de la distribución.
para . Tal que y .
Función generadora de momentos.
Media.
Varianza.
Distribución Binomial
¿Qué caracteriza o mide la variable aleatoria?
- n ensayos de Bernoulli.
- Los cuales son identicos e independientes, es decir, probabilidad de éxito permanece sin cambio de un ensayo a otro.
- La variable aleatoria denota el numero de éxitos obtenidos en ensayos.
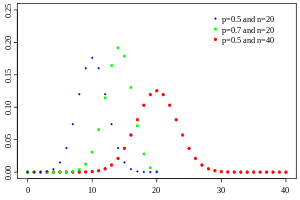
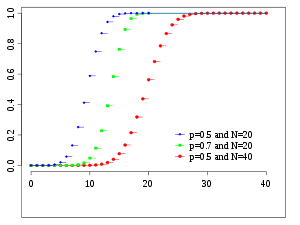
Fórmula y gráfica de la distribución.
donde n es el numero de ensayos y .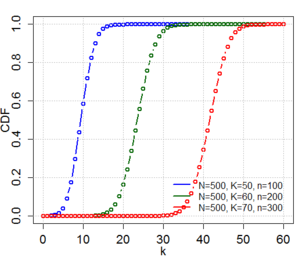
Función generadora de momentos.
Media.
Varianza.
Distribución Multinomial
¿Qué caracteriza o mide la variable aleatoria?
Se caracteriza por ser la generalizacion de una distribucion binomial para k categorias o eventos, en vez de 2 (exito o fracaso). A saber, sus parametros son y donde .
Fórmula y gráfica de la distribución.
Función generadora de momentos.
Media.
Varianza.
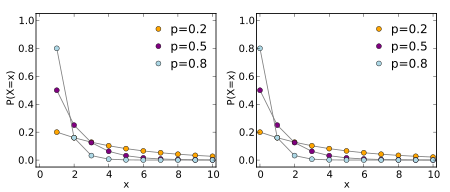
Distribución Geométrica
¿Qué caracteriza o mide la variable aleatoria?
- n ensayos de Bernoulli.
- Identicos e independientes, con la misma probabilidad de exito (parametro), tal que
- La variable aleatoria denota el numero de ensayos para obtener el primer exito. Su espacio muestral es
Fórmula y gráfica de la distribución.
Función generadora de momentos.
para .
Media.
Varianza.
Distribución Binomial Negativa
¿Qué caracteriza o mide la variable aleatoria?
- n ensayos de Bernoulli. Identicos e independientes, con la misma probabilidad de exito (parametro).
- Los ensayos se observan hasta obtener exactamente exitos. Donde el experimentador lo fija.
- La variable aleatoria denota el numero de ensayos para obtener exitos.
Fórmula y gráfica de la distribución.
Función generadora de momentos.
para .
Media.
Varianza.
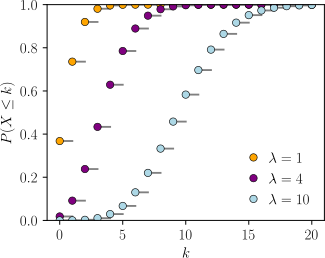
Distribución Poisson
¿Qué caracteriza o mide la variable aleatoria?
La variable aleatoria mide el numero de sucesos u ocurrencias de un evento especificado en una unidad determinada de tiempo, longitud o espacio , durante el cual se puede esperar que ocurra un promedio de estos eventos o el radio de ocurrencias de un estos eventos. Los eventos ocurrent al azar e idependientes entre si. Nace de la necesidad para distribuciones binomiales grandes.
The Poisson distrution is often used in situations where we are couting the number of successes in a particular region o interval of time, an there are a large number of trials, with a small probability of success. The Poisson paradigm is also called the law of rare events. The interpretation of "rare" is that the are small, not that is small.
Fórmula y gráfica de la distribución.
para y .
, donde el promedio de casos del evento por unidad y la magnitud o tamano del periodo de observacion.
Función generadora de momentos
Media
Varianza
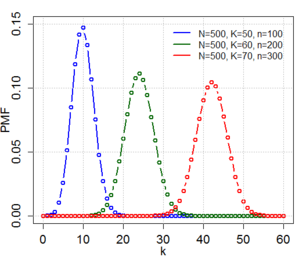
Distribución Hipergeométrica
¿Qué caracteriza o mide la variable aleatoria?
- El experimento consiste en extraer de una muestra aleatoria de tamano n sin remplazo ni consideracion de su orden, de un conjunto de N objetos.
- De los N objetos, r posee el rasgo (caracteristica) que interesa, mientras que los otros N-r objetos restantes no lo tienen.
- La variable aleatoria es el numero de objetos de la muestra que posee el rasgo.
Fórmula y gráfica de la distribución.
donde N, r y n son enteros positivos y los parametros.
Función generadora de momentos.
Donde es la genaralizacion de la funcion hipergeometrica.
Media.
Varianza.
Consideraciones.
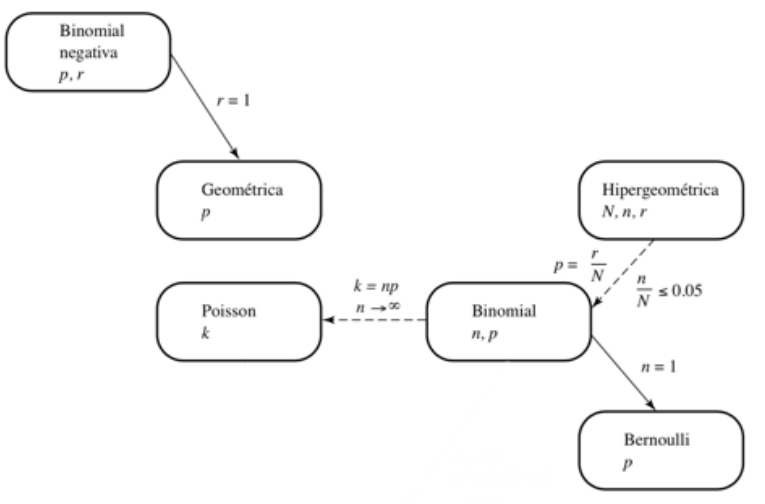
- Si el número de unidades muestreado (n) es pequeño en relación con el de objetos del cual se extrae la muestra (N ), entonces es posible usar la distribución binomial para aproximar las probabilidades hipergeométricas.
- Una regla general es que la aproximación suele ser satisfactoria si n/N ≤ 0.05.
- Si n es pequeña en relación con N, la composición del grupo muestreado no cambia mucho de un ensayo a otro, pese a que se conserven los objetos muestreados. Así pues, la
probabilidad de éxito tampoco se modifica considerablemente de un ensayo al siguiente y, para cualquier fin práctico, puede verse como una constante.
- De tal suerte, la distribución de X, el número de éxitos obtenidos en n intentos, puede aproximarse mediante la distribución binomial con parámetros n y p = r/N.
Worked examples
- Una variable aleatoria es:
Una función cuyo dominio es el espacio muestral.
2. Para que se produzca f(y) = P(Y = y) para toda y, la distribución de probabilidad para la variable discreta Y puede ser representada por
It is a graph, table or formula.
6.31 Se escoge un punto D en la línea AB, cuyo punto medio es C y cuya longitud es a. Si X , la distancia de D a A , es una variable aleatoria que tiene la densidad uniforme con α = 0 y β = a , ¿cuál es la probabilidad de que AD, BD y AC formarán un triángulo?Estrictamente menor para poder llamarlo triángulo. Si fuera menor o igual hablamos de una línea, lo cual claramente no cumple la característica principal: un polígono de tres lados.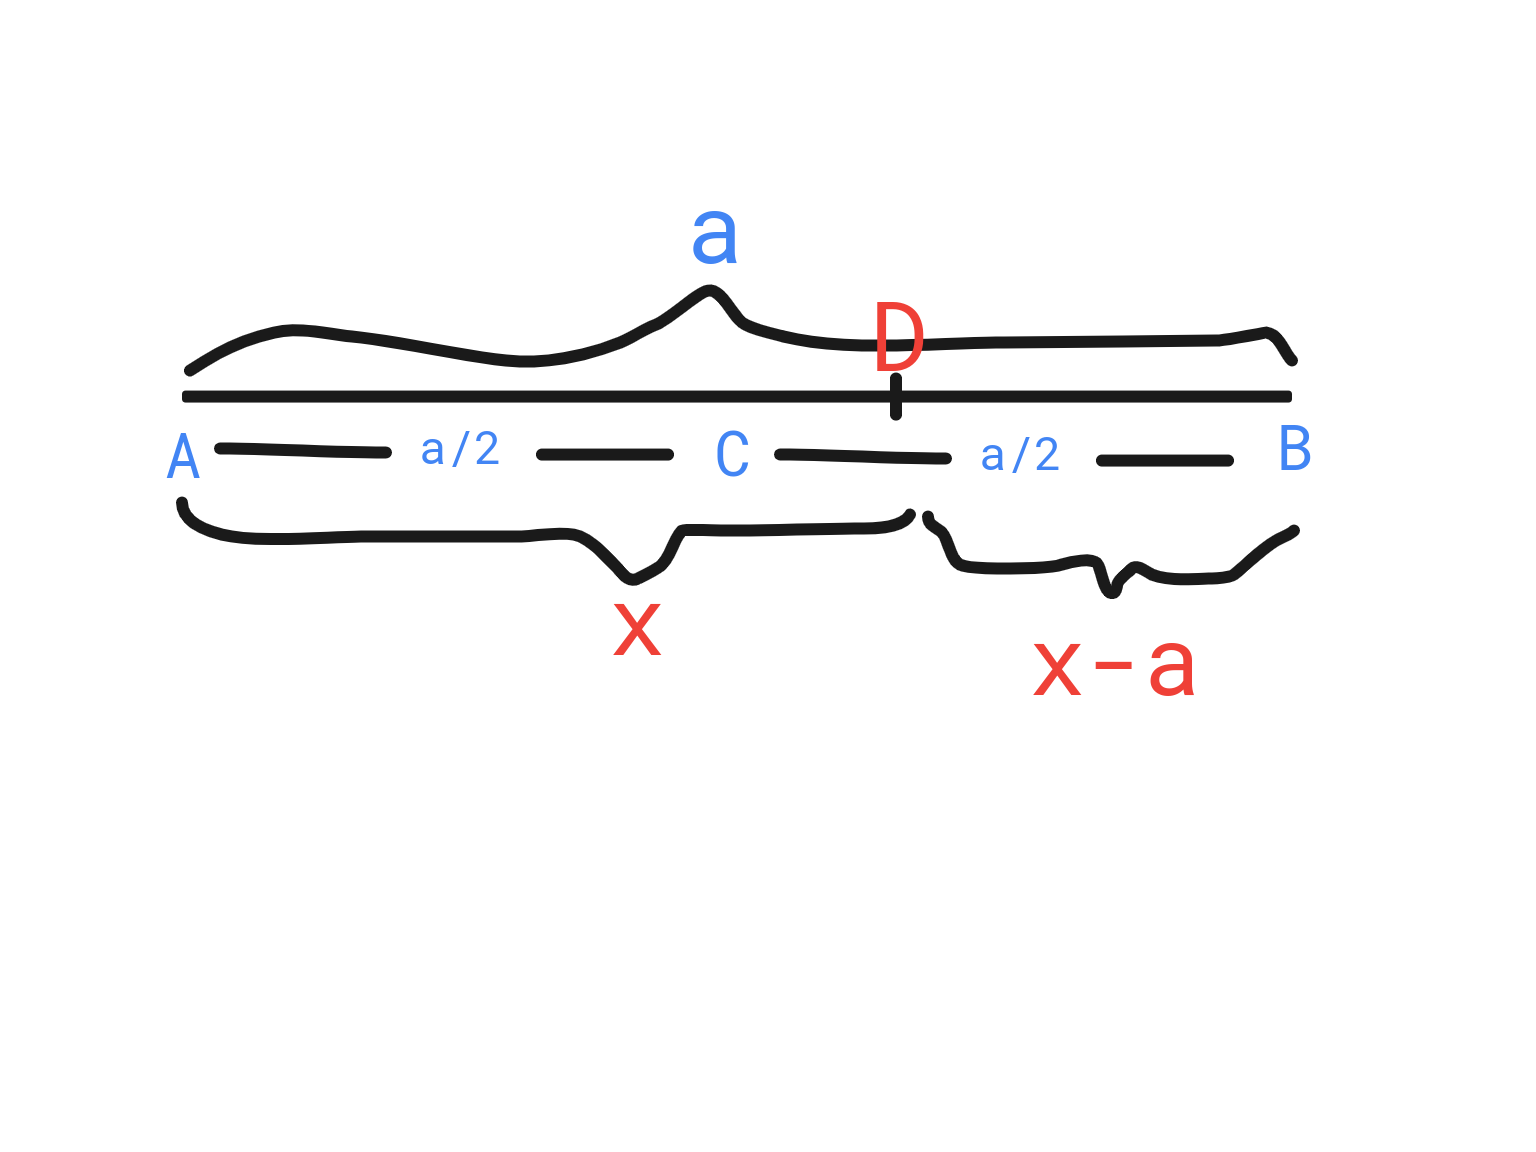
Sabemos que:
En todo triángulo la suma de las longitudes de dos lados cualesquiera es siempre mayor a la longitud del lado restante.
Es decir:
Para nuestro caso particular:
Sustituimos de acuerdo a las condiciones del problema:
Así, X como variable aleatoria cumple con lo siguiente:
Por lo tanto, la probabilidad es:
Accuracy (predictions, outcomes)
np.count_nonzero(predictions == outcomes) / len(predictions)
== np.mean(predictions == outcomes)
Stochastic process
A stochastic process is a collection of random variables, indexed by an ordered time
variable.
Markov chain

Kosambi–Karhunen–Loève theorem.
https://www.stat.cmu.edu/~cshalizi/uADA/12/lectures/ch18.pdf
TODO
Kappa
Meand-field games
Next steps
Exercises [1].
Let be the random variable representing the number of heads seen after flipping a fair coin three times. Let be the random variable representing the outcome of rolling two fair six-sided dice and multiplying their values.
Evaluate
After flips you could get the possible outcomes 0, 1, 2, and 3 heads. We know the total possibilities are , so we’ll calculate the probability for each event.
There are possible outcomes, but what are all products of multiplying two numbers between 1 and 6? For example, .
So, since we have 4 divisors and every divisor does the operation.
1 2 3 4 5 6 1 6 2 6 3 6 4 5 6 6 Generally speaking, where is the number of y’s divisors where both multipliers are between 1 and 6. For example, since is the only divisor that checks the property. A set of divisors would be .
The max number in our set is 36 since 6 and 6 are the biggest numbers and the minimum number is 1; Therefore, we are searching products between 1 and 36 (). We ignore the primes greater than 6 since their probability equals 0.
function divisors(n) {
  const numbers = 0
  for(let i=1; i<=6; i++)
     if (n%i === 0 && n/i <= 6)
       numbers++
  return numbers;
}
Array.from({length: 36}, (e, i)=> i+1)
.reduce((acc,curr) => acc+curr*divisors(curr)/36, 0)
References
- MIT OpenCourseWare. (2022, December 21). MIT OpenCourseWare. Retrieved from https://ocw.mit.edu/courses/6-006-introduction-to-algorithms-spring-2020/resources/mit6_006s20_ps0-questions
- Think Bayes: Bayesian Statistics in Python (O'reilly) 2nd Edition by Allen Downey
The Canon
| Name | Author | Why? |
|---|---|---|
| Probability and Statistics for Engineering and the Science. EIGHTH EDITION. | Jay Devore | |
| Introduction to Probability (second edition), Chapman & Hall/CRC Press (2019), ISBN 9781138369917 | Jessica HwangJoseph K. Blitzstein | |
| John E. Freund's Mathematical Statistics with Applications, 8th edition, by Miller and Miller. ISBN: 9780321807090 | John E. Freund | |
| Introduction to Probability and Statistics 14th Edición ISBN: 978-1133103752 | Barbara M. BeaverRobert J. BeaverWilliam Mendenhall Robert | |
| First Course in Probability. 9780321794772 | Sheldon M. Ross | |
| Understanding probability ISBN:978-1-107-65856-1 | Tijms H. C.. | |
| Digital textbook on probability and statistics. | Marco Taboga | |
| Probability Theory: The Logic of Science | E. T. Jaynes |
Complement
| Name | Author |
|---|---|
| Statistics versus words. Randall Collins. https://sci-hub.se/10.2307/223353 | Randall Collins |
| An Investigation of the Laws of Thought, on Which Are Founded the Mathematical Theories of Logic and Probabilities. | George Boole |
| Human Action: A Treatise on Economics | Ludwig von Mises |
| Edgeworth's Writings on Chance, Probability and Statistics | Philip Mirowski |
| Logic and Probability | Stanford Encyclopedia of Philosophy |
[7] Definition and examples of outcome | define outcome - Probability - Free Math Dictionary Online. Icoachmath.com. Retrieved June 10, 2021 from http://www.icoachmath.com/math_dictionary/outcome.html
.png)
